
This article was co-written by Machine Learning Engineer Karun Singh and Product Manager Dru Knox.
How do you know if the main points of your email are coming across to your reader? Or that your reader is absorbing the right information? Not knowing if your message will connect with your audience is a problem we’re passionate about solving at Grammarly. With this goal, our team of experts in machine learning (ML), natural language processing (NLP), and computational linguistics recently focused on how we can help users feel confident they’re conveying the key ideas of their emails.
To break down this problem, we posed two questions:
1 What are the main points of your email?
2 What parts of the email is the reader going to pay attention to? (If your main points aren’t receiving enough attention, the reader may miss something important.)
We used NLP and ML to find and highlight the sentences in an email that will receive higher vs. lower attention, and captured this in what we call an “attention heatmap.” (The other half of this problem, detecting the main points in the text, will be the subject of a future article—stay tuned!)
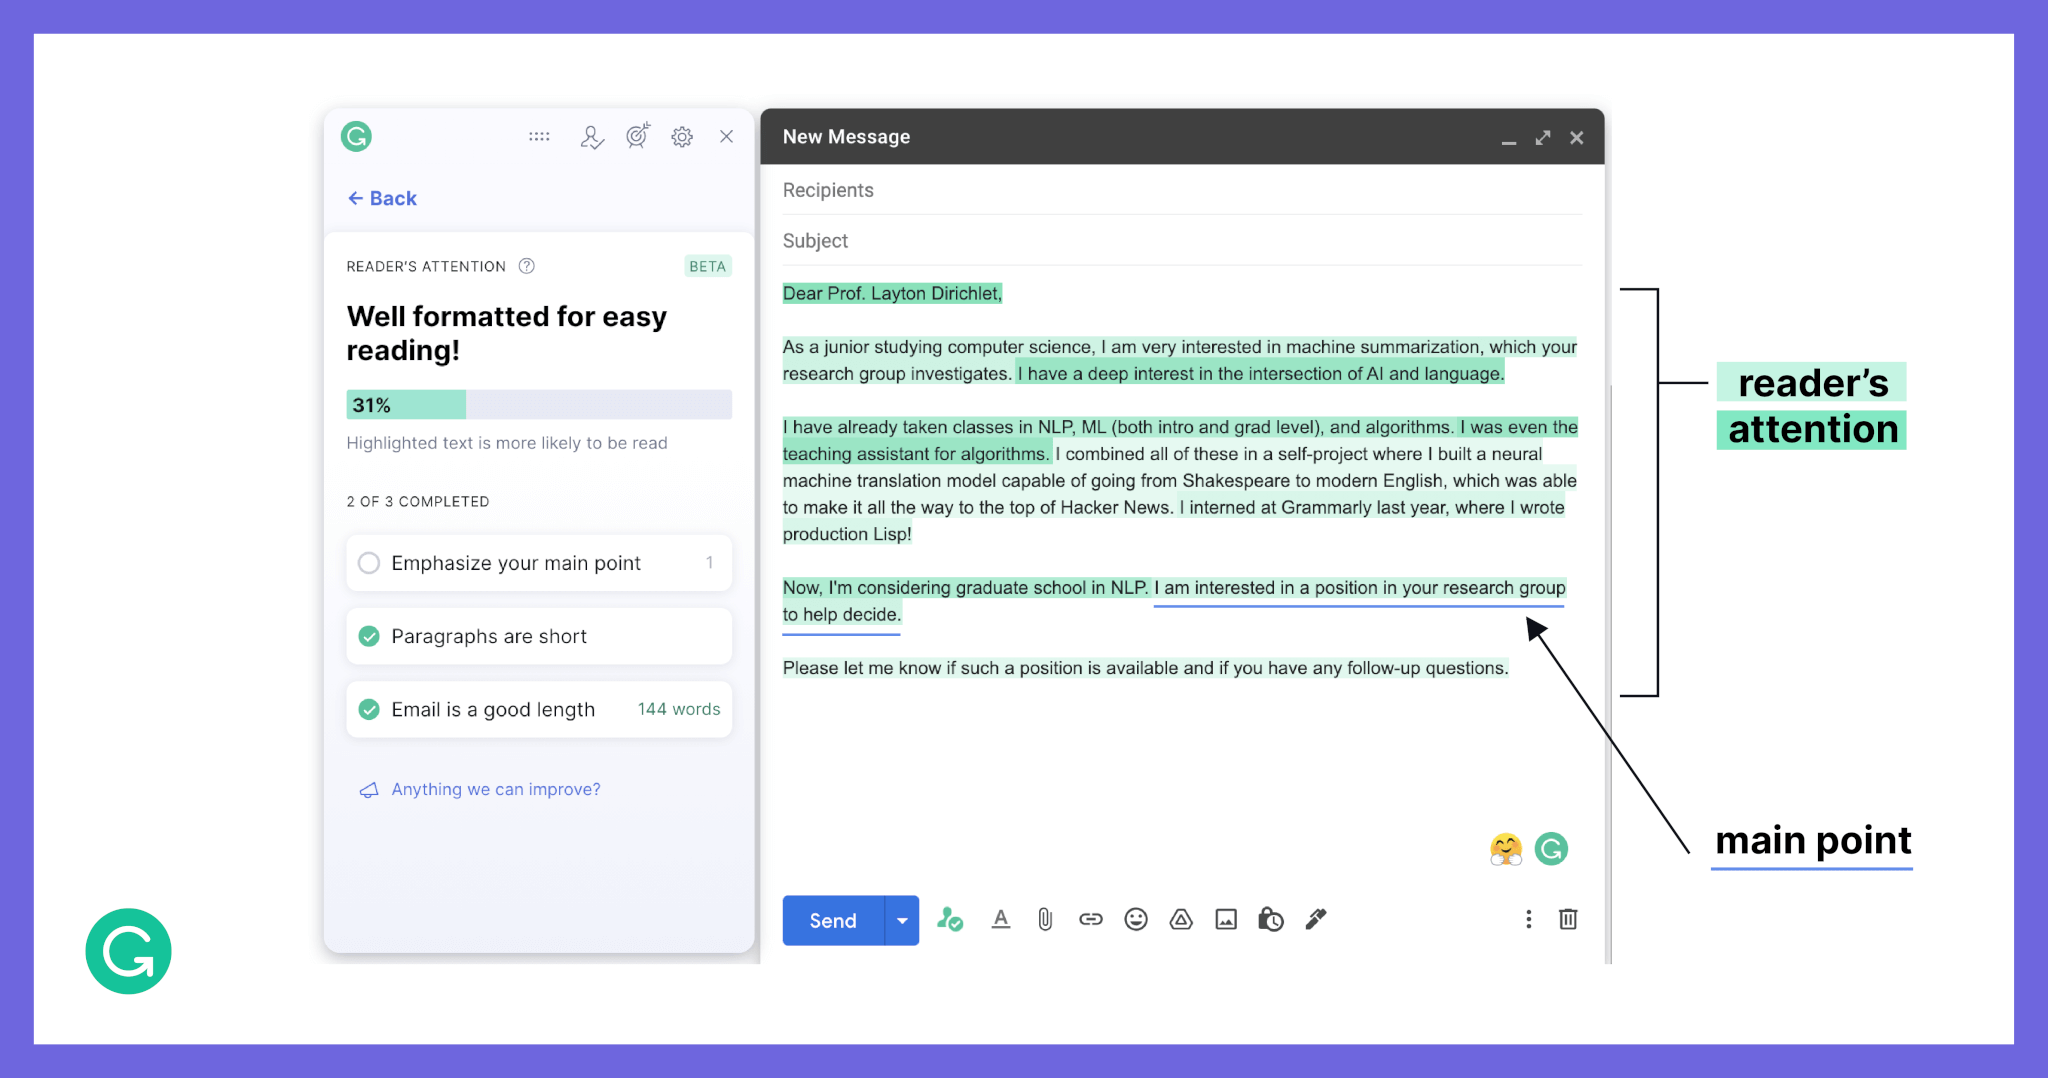
By highlighting the high and low attention sentences in different shades of green, we create a “heatmap” of the reader’s attention across a piece of text. Darker shades convey more attention.
Attention is unlike anything we’ve tried to model at Grammarly before. Typically, the modeling process involves enlisting professional linguists in labeling data; for example, marking grammatical errors or suggesting vocabulary improvements. This gives us a human-generated benchmark that we can compare various models against. Attention is different: It’s a behavior, and there’s no right or wrong answer. So we needed to find a way to measure attention (for example, academic researchers often use eye trackers). In this article, we share how we developed a solution to measure attention in a scalable manner, giving us a large dataset for iterating and improving on our reader’s attention model.
Developing an evaluation dataset for reader’s attention
Reformulating the problem
Creating an evaluation dataset that captures what readers pay attention to presented a variety of challenges from the outset. First, attention is a human behavior, not a judgment call. As such, it can’t be labeled—it can only be observed. Furthermore, attention must be observed in a hidden way, because if someone knows their attention is being measured, they’ll act differently. And finally, attention is subjective, with a lot of variance between different readers.
Could we solve some of these problems by making the concept of attention less abstract? Attention has precise definitions in academic contexts. But for our context, our first priority was to align our definition with the user problem at hand. In our email scenario, the writer cares about whether the reader absorbs the information they were trying to convey. Therefore, we chose to interpret attention as information retention, which is one definition suggested by psychology research.
Now we had a problem of measuring information retention. Looking again at the psychology field, we found many studies showing that the faster we read, the less information we process, and the less likely we are to retain it (here’s an informative review of the topic). Reading speed also has the nice property of being fairly easy to measure. By measuring reading speed, we’d have a way to approximate information retention—and, therefore, attention.
Designing a measurement method
To measure reading speed, we looked for a method that had the following characteristics:
- Accurate, minimizing the errors in the data
- Granular, giving us measurements at a detailed level (words are better than sentences; sentences are better than paragraphs)
- Unintrusive, since a person’s behavior will change if they know they’re being observed
- Scalable to deploy to a high volume of participants
- Easy to implement and cost-effective
Because Grammarly’s suggestions have to work for millions of people, we needed to collect large data sets involving many readers and thousands of documents. This ruled out the most common approach for measuring attention in academia: using eye trackers. Eye trackers yield results that are very accurate and granular, but require a physical lab and in-person participants, making it hard to scale this approach to a large, diverse pool of readers. And while there’s new research into eye-tracking through webcams, this method isn’t very discreet and is also quite brittle—the participant can’t move freely or take breaks without having to recalibrate the setup.
So we decided to approximate eye tracking with some clever tricks. We built an interface where one sentence in the document is visible at a time, while the rest of the document was blurred. The participant can use the left and right arrow keys to navigate between sentences as they’re reading, so we know exactly how long they spend on each sentence. Although we’re making some trade-offs on accuracy and granularity, this was a solution we could implement quickly and deploy at scale.
In our reading task, the reader moves sentence by sentence using the arrow keys while the rest of the document is blurred.
Defining the objective for participants
Now that we had a way to measure how much time someone spent on each sentence in an email, we spent a while thinking about what reading objective to give our participants. Why? Attention is highly dependent on the reader’s goal.
For example, the same blog post can be read with different objectives in mind. An editor might scrutinize it in great detail, looking for minute grammatical mistakes, while a reader on the internet might only skim it, looking for the key takeaways they care about. With their different goals, these two readers would output very different attention heatmaps.
When developing our dataset, we wanted to set up an objective for our readers that would be close to an email reader’s objective. Our hypothesis was that email readers are primarily trying to understand at a high level what the writer is communicating. As a way to encourage readers to mirror this behavior, we asked them to summarize the intent of each email in one sentence. By also rewarding our readers for both the number of emails they got through and the accuracy of their summaries, we tried to approximate the trade-offs that people make as they review their inboxes.
Results
With our task in place, we constructed a set of emails and participants that was as representative as possible, which we validated with several increasingly large pilots. We aggregated data from ten different readers on the same email, building in this redundancy to reflect the fact that attention is subjective. Because everyone naturally reads at a different rate, we normalized the data around each reader’s average speed.
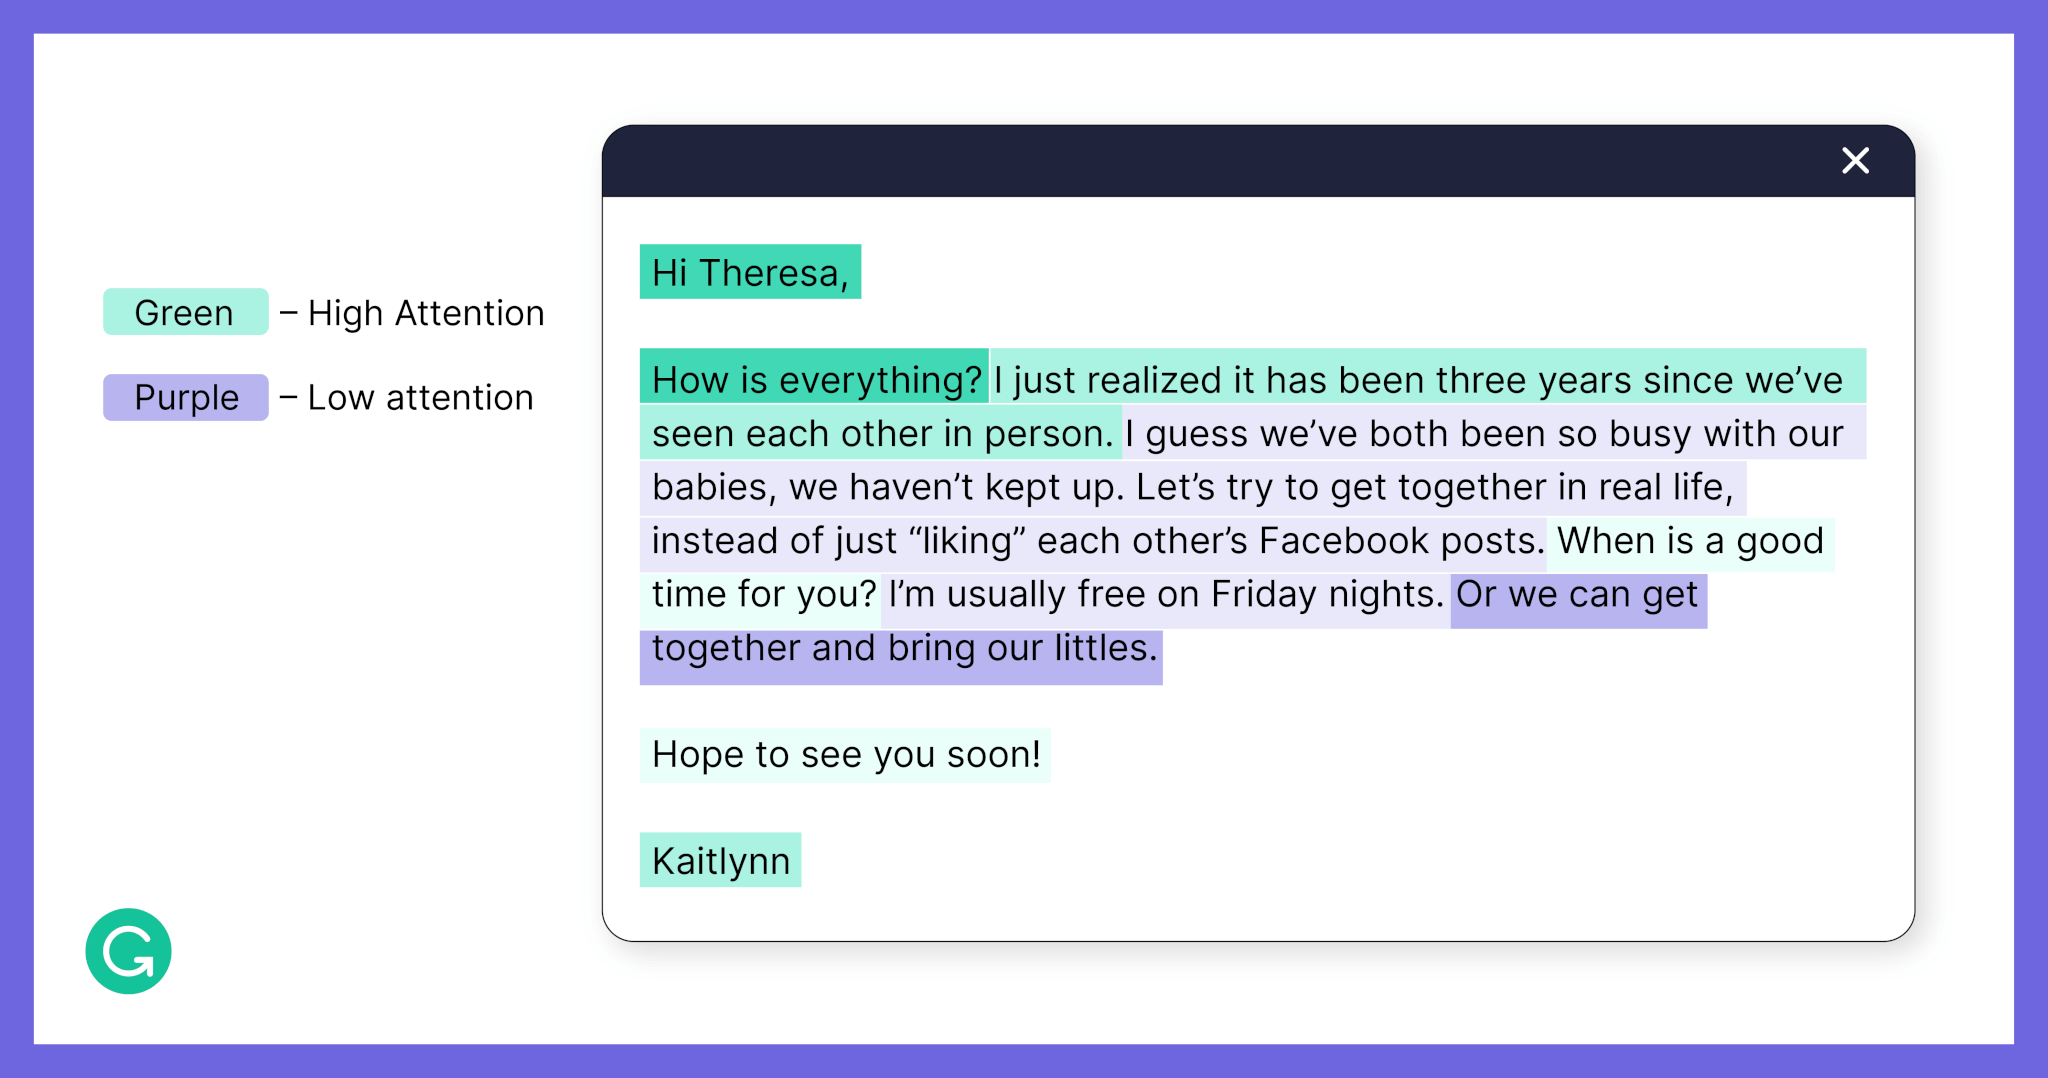
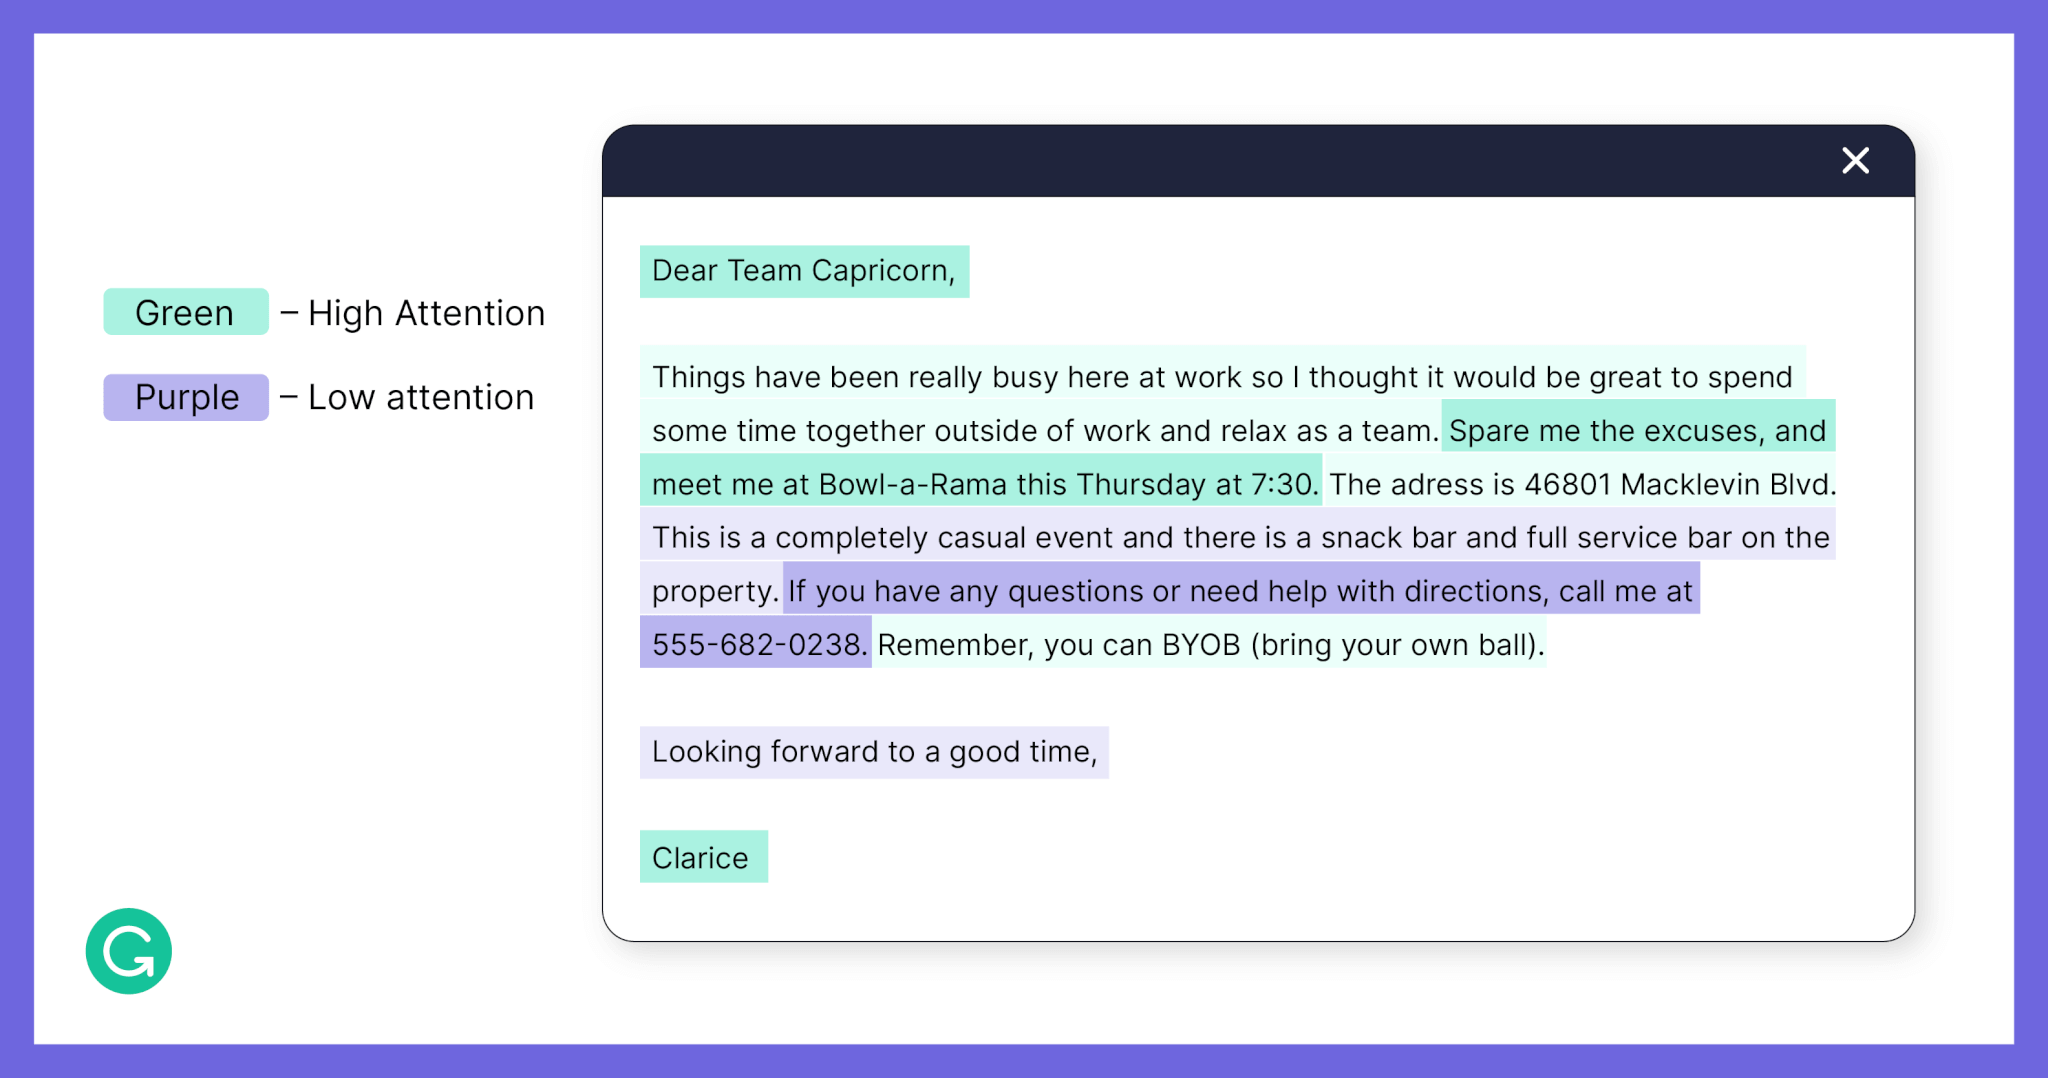
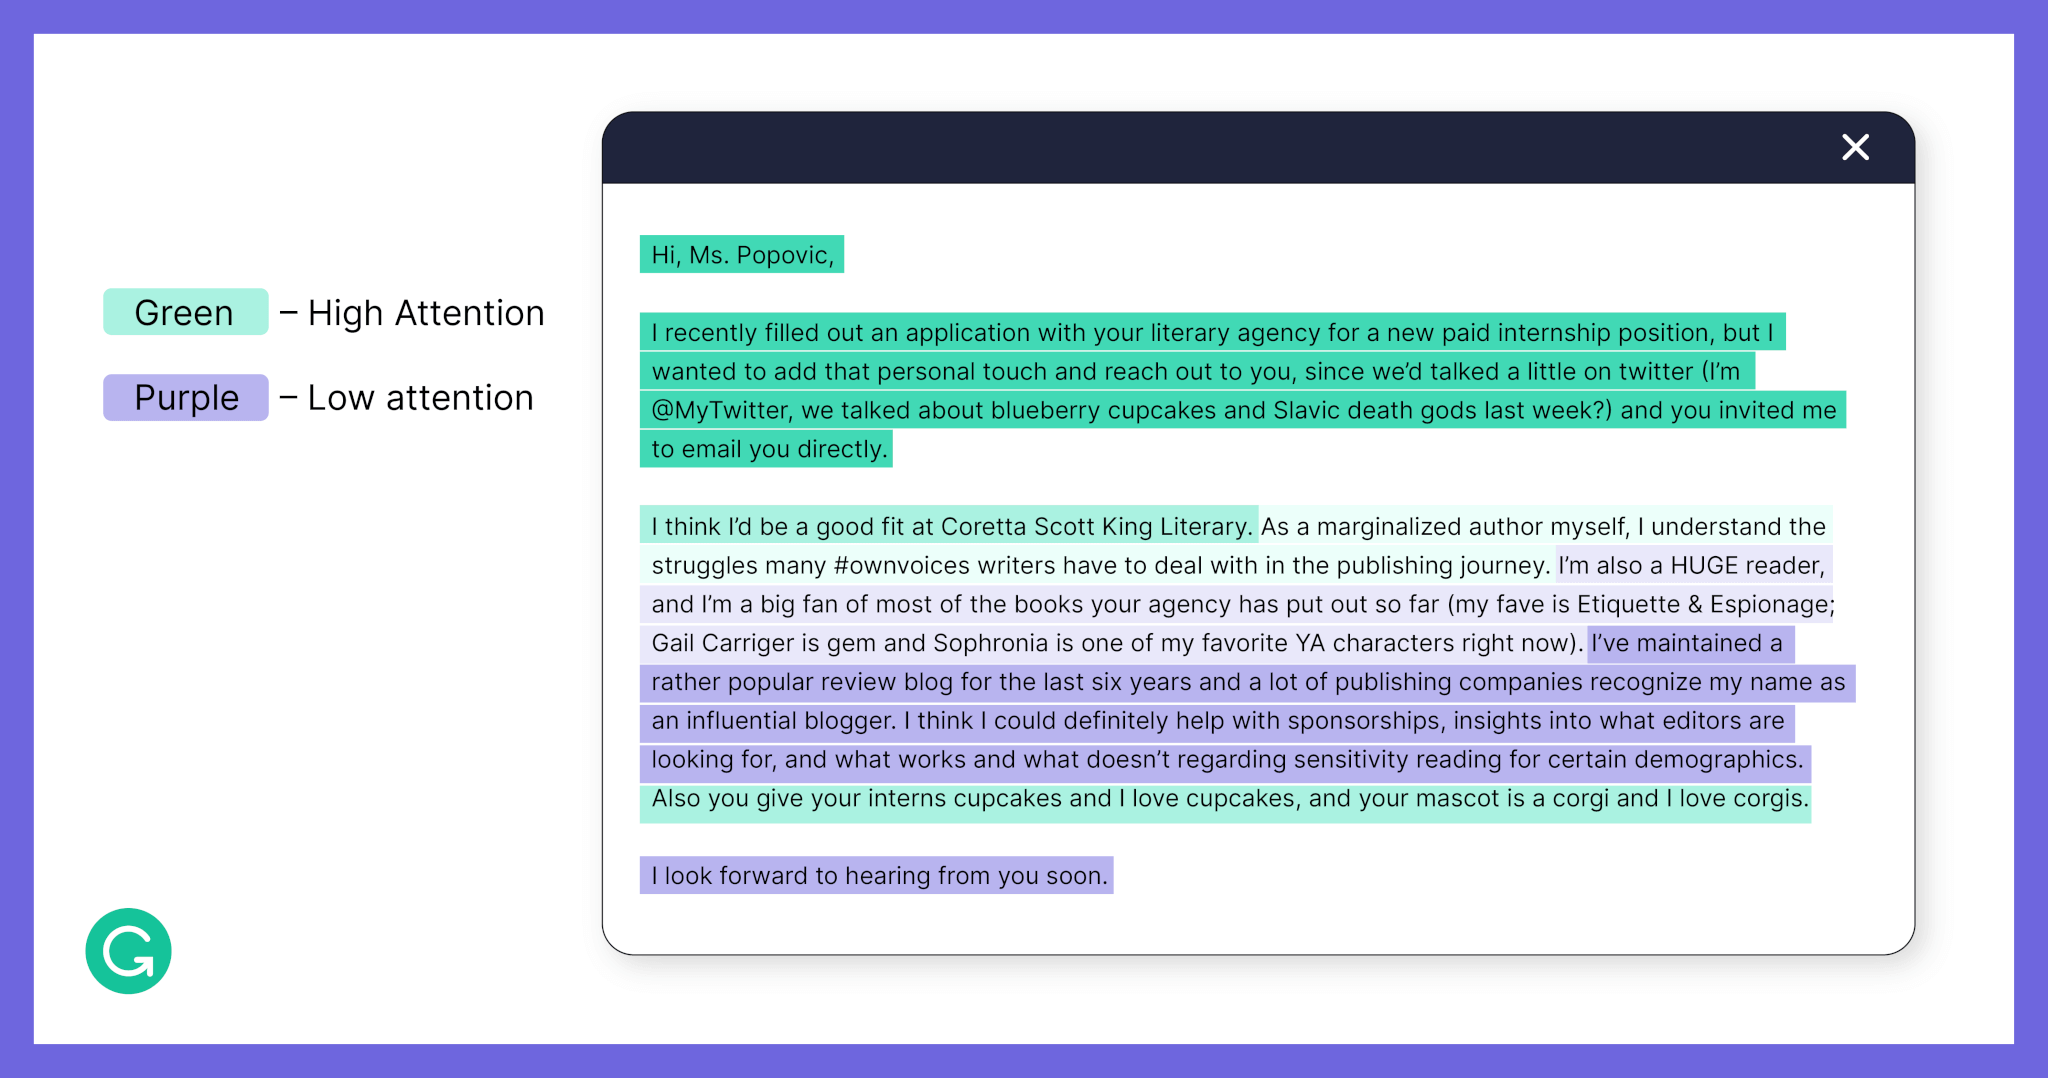
Below, you’ll find a few examples of heatmaps in our dataset reflecting different contexts: an informal email between friends, a memo to a corporate team, and a follow-up on a job application. We hope that they provide a sense of the complexity of this problem and the variety of attention patterns that we see.
In these examples, sentences highlighted in green had high attention (with darker green sentences receiving the most attention) and purple sentences had low attention (with darker purple sentences receiving the least attention).
Email between friends
Team memo
Job application follow-up
Evaluation metrics
Once we had an evaluation dataset, we could start using it to score and compare different modeling approaches. We currently use a combination of three different types of metrics to measure model performance against the evaluation dataset.
We use regression-style metrics (such as mean absolute error, root mean squared error, R-squared, etc.) to measure how much the models’ predictions deviate from the measured attention. We also use recall-style metrics, which bias us toward accuracy on errors that could impact users—like if the model classifies a low-attention sentence as a high-attention one. Finally, we use likelihood-style metrics to account for the fact that attention is subjective. If the model makes an error on a sentence where attention varies a lot across readers, we can be more lenient.
Modeling reader’s attention
Building an evaluation dataset and developing metrics let us iterate and improve on a model for reader’s attention. When modeling this problem, we have an interesting constraint: We need to maintain explainability. Grammarly’s writing assistant presents suggestions for the writer to consider. If we don’t provide a reason why Grammarly suggested something, it could be confusing. Relatedly, we need to make it clear how the text can be improved in order to make the suggestion actionable. Having an explainable model helps with that as well.
As a result, instead of plugging in a black box model, we’re trying to model reading behavior from scratch. Our very first model was based on a heuristic from eye-tracking studies of reading behavior on the internet. When people read web pages or search engine results, as they move vertically down the screen they do less horizontal scanning—resulting in an attention heatmap that looks like the letter F.
![]()
Here is an example of the F-shaped heuristic from the original study by the Nielsen Norman group.
The F-shaped pattern was a good starting point, but insufficient for Grammarly’s use case. Those studies were carried out on web pages, which is a very different context from emails or documents. We developed a new model for reading behavior by considering the cost-value trade-off that seems to happen when people read. Readers are trying to maximize value (information) while minimizing cost (time and effort required). With this hypothesis, we designed a model that uses linguistic features to compute a cost and a value for each sentence in the document.
The model ranks the sentences in the document, with high-value sentences and low-cost sentences at the top, and then distributes the readers’ attention in order. Compared to the F-shaped heuristic approach, our new cost-value model reduces errors by half and creates heatmaps that are 6.5 times more plausible.
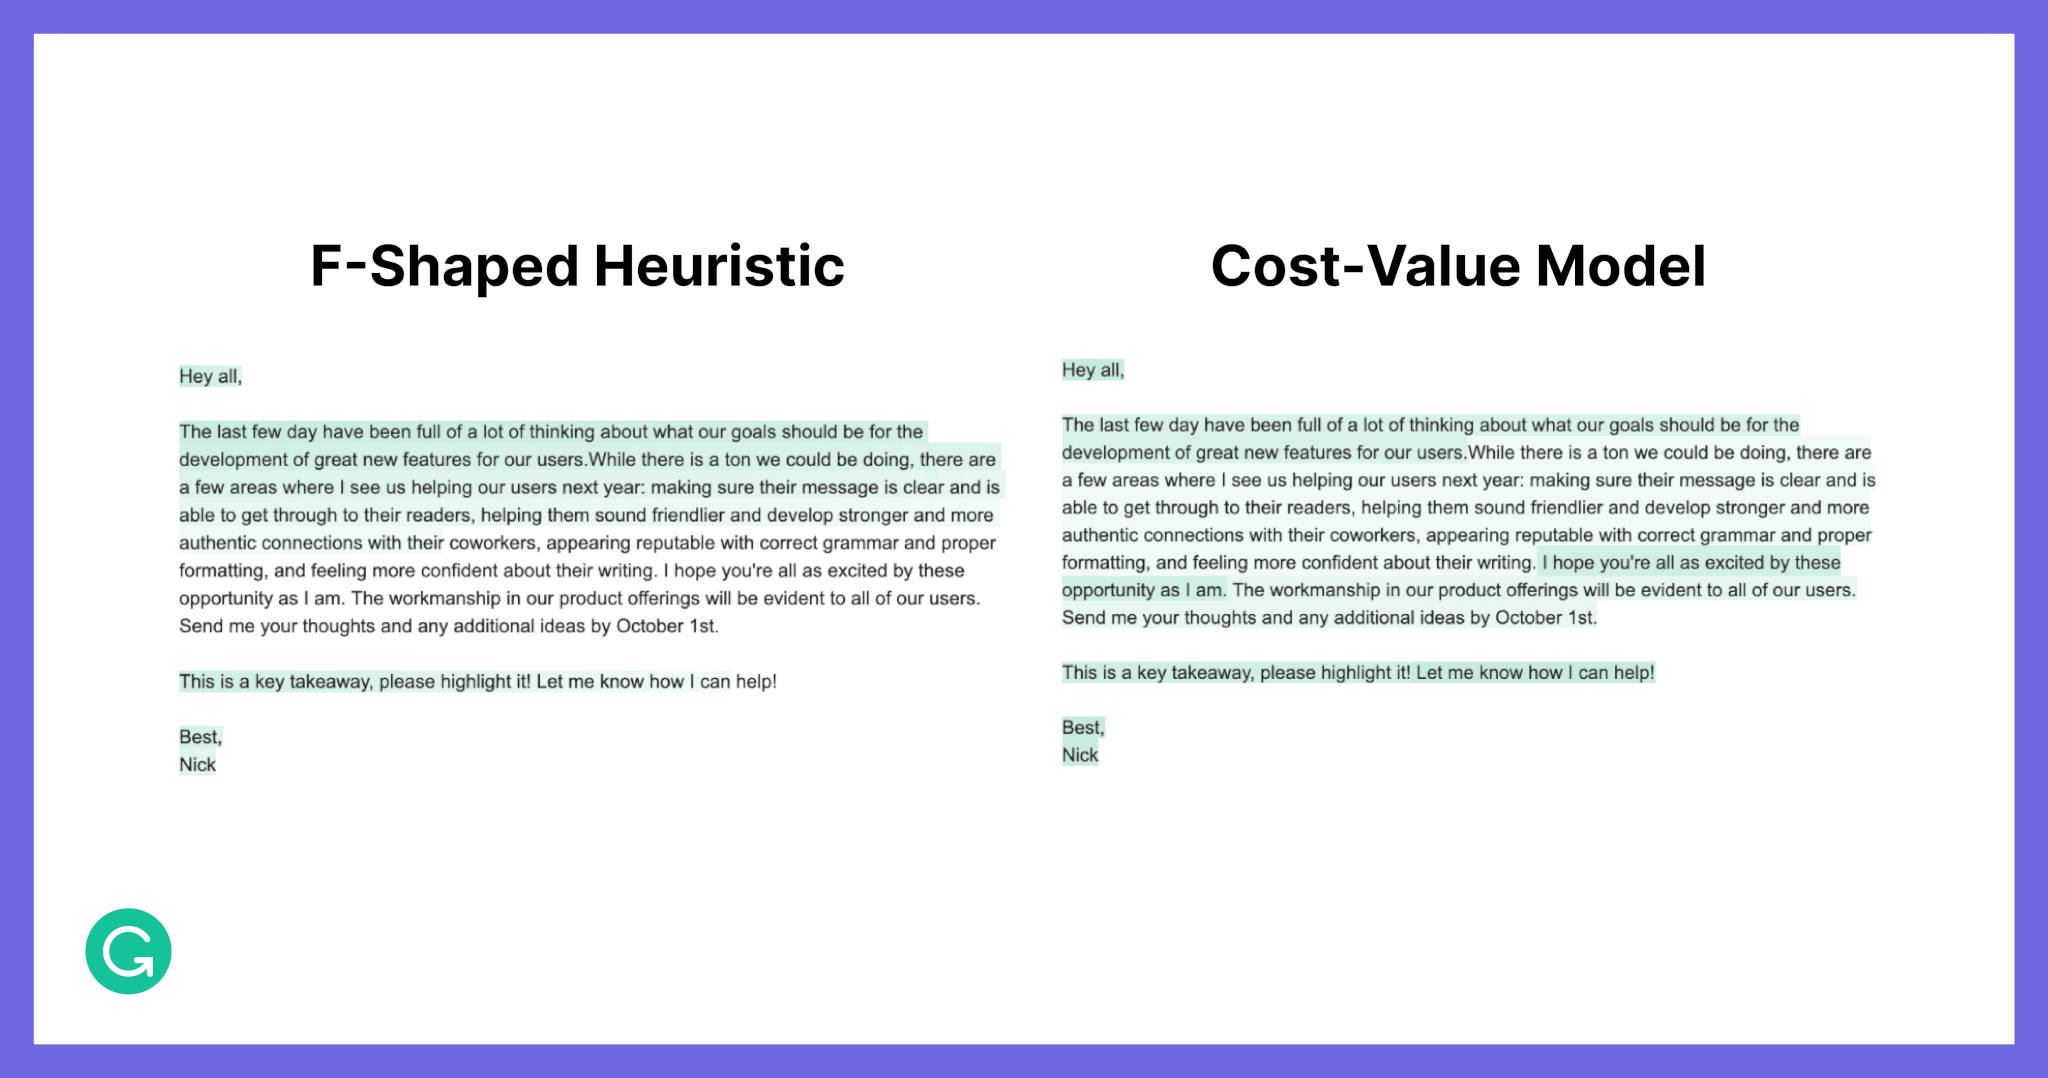
Here’s the heatmap that our cost-value model creates on the right, compared to the F-shaped heuristic model on the left.
We’ve continued to improve our results through extensive feature-exploration studies. On the ML/NLP team at Grammarly, we’re fortunate to be working with domain experts embedded on our team. Computational linguists (CLs) bring semantic features that we otherwise would have overlooked to the table, and help us test ideas and quickly iterate on features. Working with our in-house CLs, we assessed more than 40 core linguistic features (and hundreds of derived features) like unigram/bigram frequency, type-token ratio, sentence parse tree depth, Flesch reading ease, and many others. Incorporating such features has led to a further 17% reduction in error and increased recall from 68% to 79%.
Future directions
There are many areas we’d like to improve to create even more realistic datasets to measure attention. Since attention can vary so much between different people, we’d like to bring in an even more diverse set of readers to participate in our task. We’re also thinking about how to make sure that the task feels more like a real-world experience of reading an email. Finally, we’re thinking about how we can measure information retention directly, such as with an information recall quiz.
On the modeling side, we’re continuously working on accuracy improvements. We’re also currently investigating ways to model different reading behaviors. Reading behavior varies a lot based on individual reader attributes, such as someone’s familiarity with the English language or how preoccupied they might be at the time. Reading behavior is also highly dependent on context, such as whether you’re reading a company newsletter or an email from your manager. We’ll need to gather new data and continue honing our model to support all these variations.
Want to join Grammarly’s ML/NLP team and solve interesting, impactful challenges like this one? We’re hiring! Check out our job postings here.